A Fundamental Study of VIV Fatigue Analysis Procedure for Dynamic Power Cables Subjected to Severely Sheared Currents
This is an Open-Access article distributed under the terms of the Creative Commons Attribution Non-Commercial License(http://creativecommons.org/licenses/by-nc/3.0) which permits unrestricted non-commercial use, distribution, and reproduction in any medium, provided the original work is properly cited.
Abstract
The subsea power cables are increasingly important for harvesting renewable energies as we develop offshore wind farms located at a long distance from shore. Particularly, the continuous flexural motion of inter-array dynamic power cable of floating offshore wind turbine causes tremendous fatigue damages on the cable. As the subsea power cable consists of the helical structures with various components unlike a mooring line and a steel pipe riser, the fatigue analysis of the cables should be performed using special procedures that consider stick/slip phenomenon. This phenomenon occurs between inner helically wound components when they are tensioned or compressed by environmental loads and the floater motions. In particular, Vortex-induced vibration (VIV) can be generated by currents and have significant impacts on the fatigue life of the cable. In this study, the procedure for VIV fatigue analysis of the dynamic power cable has been established. Additionally, the respective roles of programs employed and required inputs and outputs are explained in detail. Demonstrations of case studies are provided under severely sheared currents to investigate the influences on amplitude variations of dynamic power cables caused by the excitation of high mode numbers. Finally, sensitivity studies have been performed to compare dynamic cable design parameters, specifically, structural damping ratio, higher order harmonics, and lift coefficients tables. In the future, one of the fundamental assumptions to assess the VIV response will be examined in detail, namely a narrow-banded Gaussian process derived from the VIV amplitudes. Although this approach is consistent with current industry standards, the level of consistency and the potential errors between the Gaussian process and the fatigue damage generated from deterministic time-domain results are to be confirmed to verify VIV fatigue analysis procedure for slender marine structures.
Keywords:
Vortex-Induced Vibration(VIV), Dynamic power cable, Fatigue analysis, Modal analysis, Higher order harmonics키워드:
와류유기 진동, 동적 전력케이블, 피로해석, 모달 해석, 고차 조화운동1. 서 론
VIV is an important issue in the design of riser, umbilical, and dynamic power cable due to periodic vortex shedding, which causes fatigue damage on the structures. When currents exceed a certain velocity, the vortex shedding occurs on the back of the structures due to the drastic change in the gradient, leading to cyclical loadings and the occurrence of VIV through mutual interaction between the structure and vortex shedding. In particular, when the frequency of vortex shedding approaches the natural frequency of the cable, resonance can occur, resulting in large displacement oscillations known as “lock-in”. To fully develop dynamic power cables, it is necessary to assess fatigue life through VIV fatigue analysis, considering the environmental conditions measured on-site. Based on the results of VIV fatigue assessments, additional suppression systems such as strakes or fairings can be implemented for the cable.
This section provides a comprehensive overview of the research studies conducted on VIV. Wu et al. (2009) introduced a technique to derive VIV forces from collected data obtained from lengthy elastic riser models under the influence of current. Their method specifically focused on determining the first-order cross-flow force coefficients.
Soni and Larsen (2009) conducted an investigation on how to determine the hydrodynamic coefficients induced by the combined feasible motions of cross-flow and in-line flow. They extracted the force elements of higher order harmonics for each motion path, considering a combination of vortex shedding types and higher order harmonics. Zheng et al. (2011) estimated the vibrations of marine risers in the cross-flow direction under random currents using a specific program designed for VIV evaluations. They demonstrated that the insufficient number of nodes in the response of the marine risers can be attributed to a combination of standing waves and traveling waves along the length of the risers. Unlike VIV models that operate in the frequency domain, a time domain model offers the advantage of capturing the interactions between in-line and cross-flow vibrations, higher-order frequency components, structural nonlinearities, as well as simultaneous effects from other loads such as waves and imposed motions at boundaries (Maincon and Larsen, 2011). Schiller et al. (2014) provided evidence that various attributes of the current profile, including shear (du/dz), velocity (u), and direction (θ), significantly influence the development of VIV in riser models. Specifically, more intricate current profiles exhibit a discernible impact on the characteristics and stochastic behavior of VIV. Passano et al. (2016) introduced a methodology for conducting a VIV analysis of an umbilical, specifically focusing on the inclusion of slip damping. The authors presented techniques for estimating both material damping and slip damping. The findings of a case study demonstrated that the VIV response is highly sensitive to the level of damping. Pagnini et al. (2020) examined technical aspects related to VIV of structures subjected to wind excitation, specifically focusing on the spectral model commonly utilized in various codes and guidelines. The researchers highlighted that an analytical solution enables straightforward assessments, incorporating operational criteria to accurately account for both structural and flow conditions.
Experimental studies on VIV and cables have also been conducted, and some of the notable studies in this field are presented hereafter. Passano et al. (2010) conducted a comparison between VIV predictions obtained from a semi-empirical program and experimental data collected from a free span pipeline. They utilized a long elastic pipe model for their analysis, considering both combined cross-flow and in-line loading. The results indicated that the response estimates obtained from the program aligned well with the experimental data. Fu et al. (2013) conducted experimental investigations on VIV in oscillatory flow within an ocean basin. The findings revealed distinct differences between VIV in oscillatory flow compared to steady flow. Specifically, as the maximum shedding frequency increased, the lock-in region exhibited a more broad region. Additionally, cases with larger KC (Keulegan-Carpenter) numbers tended to show a pure lock-in phenomenon. According to Rao et al. (2013), an examination of VIV excitation competition between bare and buoyant segments of flexible cylinders demonstrated that the excitation occurring on the buoyant regions largely influences the VIV response across various buoyancy configurations. Wu et al. (2017) conducted experiments to acquire hydrodynamic data for a riser equipped with staggered buoyancy elements. The aim was to investigate the interaction between these buoyancy elements and the bare riser section. The findings demonstrated that this interaction had notable effects on the VIV responses and force coefficients. The extent of these influences was found to depend on the dimensions of the buoyancy element and its arrangement within the riser. Shim et al. (2021) performed physical tests to evaluate the endurance of dynamic power cables in operational environments and developed relevant testing techniques for this purpose. Wu et al. (2021) introduced a thorough experimental model that was conducted in a towing tank. The objective of the study was to investigate the hydrodynamics and motion characteristics of a tunnel-pontoon system. Kim and Rheem (2009) investigated the cross-flow VIV response in the presence of local shear flow. They confirmed the presence of common VIV characteristics, such as lock-in phenomena, through experiments conducted in uniform flow conditions.
Studies on VIV fatigue have been conducted as follows. Jhingran et al. (2007) validated the significance of higher harmonics in estimating the fatigue life of pipes. They developed an approach to incorporate these higher harmonics into fatigue design related to VIV. The multi-mode solution, depending on the fluid riser parameters, offered valuable insights into the VIV characteristics of catenary risers. Notably, as the flow velocity increases, the presence of multiple internal resonances between higher and lower modes becomes significant. This behavior is attributed to geometric nonlinearities and cannot be captured by a linear structural model (Srinil et al., 2009). Researchers have shown great interest in obtaining information on the forces involved in VIV experiments with long elastic cylinders. This interest arises from the challenges associated with directly measuring these forces during such experiments. Marcollo et al. (2011) made meaningful contributions to the study of the occurrence and predominance of traveling wave VIV response in full-scale drilling risers. Their research revealed that fatigue damage in the drilling riser is more uniformly distributed in the upper region where traveling waves dominate, contrary to the predictions made by the classical normal mode assumption. Sodahl et al. (2011) highlighted the importance of including fatigue stress calculation and evaluating equivalent modal damping in the VIV analysis, particularly concerning the stick/slip mechanism of the helix elements in bending. These elements play crucial roles in accurately assessing the effects of VIV and ensuring the reliability of the analysis. Zhang et al. (2020) proposed the inclusion of floating body movement in the assessment of VIV of risers. They emphasized that considering the combined effect of the top-end surge caused by the movement of the floating body and the background flow is crucial for understanding the high-order harmonics of VIV frequency and the amplification of VIV amplitude at specific reduced velocities. This phenomenon has the potential to induce additional fatigue damage to the riser. Lekkala et al. (2022) performed a VIV fatigue damage analysis to examine the influence of higher harmonics. The findings revealed that higher harmonic correction factors significantly affect the performance of the riser. This suggests that considering the contribution of higher harmonics is crucial for accurate assessment and prediction of fatigue damage in VIV analysis.
As VIV fatigue analysis is still a developing research field, extensive experience and the establishment of a reliable procedure for VIV fatigue analysis are essential, particularly for dynamic power cables, which are helically wound long flexible structures consisting of various components. For these structures, stick/slip phenomenon between layers due to the tension or the compression loaded by environmental conditions, contact forces between layers, torsional moment & axial force for individual layers, and bending stiffness and curvature of whole cross-section are all must be taken into consideration. In this study, the procedure of VIV fatigue analysis for dynamic power cables is presented and the demonstration of VIV fatigue analysis cases are provided considering sheared current profiles.
2. Procedure of VIV fatigue analysis for a dynamic power cable
The VIV fatigue analysis of a dynamic power cable has broadly been categorized into three stages by utilizing three separate programs.
2.1 Static configuration and modal analysis
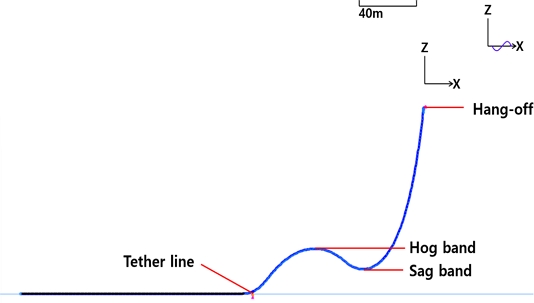
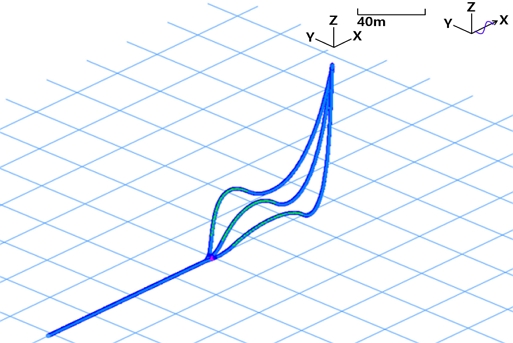
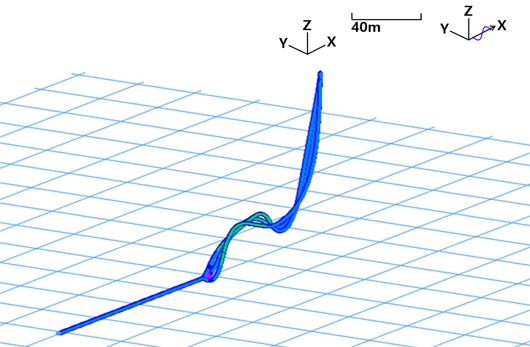
First, The static analysis was performed by OrcaFlex. OrcaFlex has been used for modeling of the dynamic power cable and static analysis. The static analysis includes a cable line configuration (Fig. 2), current fluid incidence angle and tensions of each node along the cable. Finally, the modal analysis was carried out to obtain the mode shapes of cross-flow and in-line VIV directions as depicted in Fig. 3, Fig. 6, Fig. 7, Fig. 10, and Fig. 11, for example. If the configuration is independent of current profiles, common mode shapes regardless of current profiles can be applied to VIV prediction. In case of high currents, the cable static configurations after application of each current profile must be used for modal analysis and subsequent VIV fatigue analysis because the configurations of the cable are dependent on high currents and strong current forces contribute significantly to the fatigue damage.
2.2 VIV prediction by empirical force based model
After completion of the modal analysis, VIV calculations were conducted by Shear7 (Shear7, 2021). Shear7 is cross-flow and pure in-line VIV prediction program using a mode superposition method. Shear7 evaluates the vortex shedding and the excited modes, and finally predicts the VIV response of a slender structure with varying tension in uniform and sheared current flows. Hereafter, power-in (lock-in) and power-out (damped) regions along the cable are identified by VIV prediction and empirical models of lift force coefficients are applied to confirm the variation of amplitudes and a cycle counting. Through this stage, the following results have been obtained.
- • Excitation frequencies
- • Excited modes of the cable
- • Stress time series of each node
- • Curvature time series of each node
- • Cycle counting
- • Power spectral density
2.3 Cross-section properties and fatigue life
First, cross-section properties of dynamic power cable must be estimated by Helica. Major properties of cross-section of the cable are as follows.
- • Capacity curve (curvature vs. tension)
- • Torsion moment in layers
- • Axial force in layers
- • Contact force in layers
- • Bend stiffness by curvature
- • Bending moment by curvature
- • Initial and full slip curvature for each helix component
- • Relative contribution to bending stiffness
Next, cross-flow or in-line fatigue damage can be calculated by utilizing excited modes and curvature time series which are found in the previous step. To accurately calculate the fatigue stress considering the stick/slip behavior of helix elements, it is necessary to transform the frequency domain VIV response to the time domain, as mentioned by Sodahl et al. (2011). This transformation allows for a more comprehensive analysis and evaluation of the fatigue stress, taking into account the dynamic behavior of the helix elements over time. Fatigue stresses can be evaluated at prescribed hot-spots in the particular helix positions which are covering one pitch. Finally, accumulated long-term fatigue life assessments were performed in Helica.
3. Analysis model
3.1 Dynamic power cable
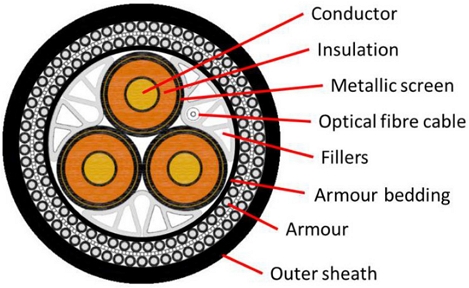
Initially, a global model of floating wind turbine has been developed for fully-coupled analysis with mooring lines and a dynamic power cable. However, this study is not related to the design of floating structure or the optimization of mooring system because only a subsea power cable has been used for VIV fatigue analysis of the cable to develop a 70kV dynamic cable system that will be applied to a floating offshore wind turbine. The cable cross section (outer diameter is 190mm) mainly consists of three power phases and two steel armor wires. In addition to these, the cable comprises fillers, armor bedding and outer sheath. Each power phase has center strand and 1st~4th helical layers (circular helix type) including insulation, copper shield, and outer sheath. Typical cross-section of dynamic cable (Cigre, 2022) is presented in Fig. 1.
For a dynamic power cable installation, a lazy wave configuration is chosen to minimize the tensions induced by the dynamic coupling between the floater and the cable. The dynamic power cable is laid from the floater in 180 deg direction (west). First, stiffness properties including nonlinear bending stiffness and capacity curves (curvature vs. tension) have been calculated for single power core. From the results of single power core which is called a sub-model, mechanical properties of whole cross-section of dynamic cable have been calculated in which contact forces to be used in estimating radial stiffness to include an interlay contact. A cable model (FE model) was made in OrcaFlex and is used as input to the modal analysis. Through the modal analysis, eigen modes of the dynamic cable were calculated. However, only the cable itself need to be included to perform a VIV analysis for simplifications. Therefore, the global model was stripped down to include only the dynamic cable with a bend stiffener at the hang-off and a tether line at seabed. Fig. 2 shows the cable model after being stripped and ready for the modal analysis.
Static analysis of the cable itself is the first step. The main purpose of the static analysis is to have correct configurations and correct tension levels along the cable after equilibrium. The tension is necessary to calculate correctly the friction stresses between internal components in the cross-section.
3.2 Met-ocean current profiles
In this study, operational characteristic current profiles for VIV analysis are provided to explore the influence of severely sheared currents on the amplitude variation due to VIV of the dynamic power cable. The current data consist of 481 profiles corresponding to water depth level until 130m with % occurrence probabilities. A considerable number of current profiles are a bit severe and become even stronger as they approach to the seabed. If we assume that the current loads play a minor role on these responses, current is avoided in the static analysis. It means that gravity, buoyancy and vessel offset are included in the static analysis to have common mode shapes regardless of current states. However, in the previous research, it was found that the static configurations and the mode shapes of the cable were affected by the severe current loading, i.e. the mode shapes of the cable are dependent on the current states to which the cable will be exposed. Consequently, the mode shapes of the cable have been extracted from OrcaFlex for each current profile respectively.
4. Modal analysis
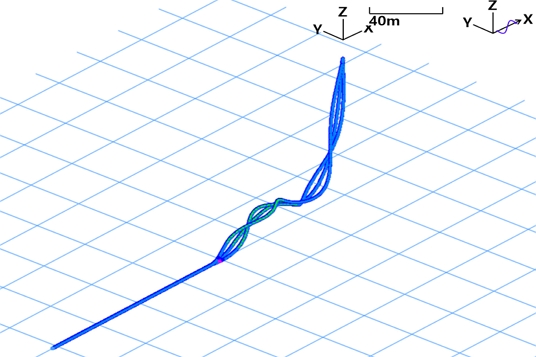
The modal analysis has been performed to determine the frequency, mode type and curvature of each eigen mode of the cable system. OrcaFlex categorizes the in-line modes as the modes vibrating in the azimuth direction of laid cable and the transverse modes as vibrating 90 degrees to the in-line modes. In this study, VIV analyses only consider loadings and responses with the transverse modes assuming the response amplitudes of cross-flow VIV direction are significant compared to those of in-line VIV direction. Fig. 3 illustrates the primary mode shape (mode No. 1) of transverse modes of the first current profile calculated from OrcaFlex.
4.1 Excited modes by VIV prediction
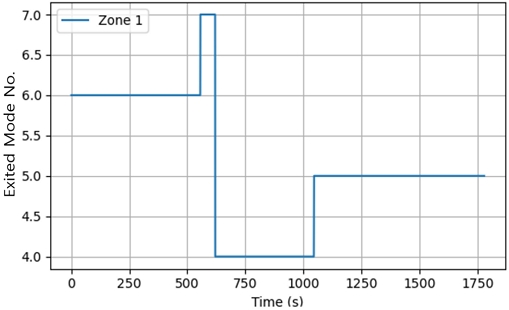
The inputs for separate VIV analyses consist of current profiles and the static analysis results from OrcaFlex. As mode shapes to be used are different from each current profile in this study, the load cases have been applied for Shear7 repeatedly to predict the excited modes of VIV among calculated eigen modes and generate corresponding curvature time series of each node of the cable for the particular current profile. For example, the first current profile (denoted as “Profile 1.0”) and the excited modes of the cable subjected to the corresponding current are depicted in Fig. 4 and Fig. 5.
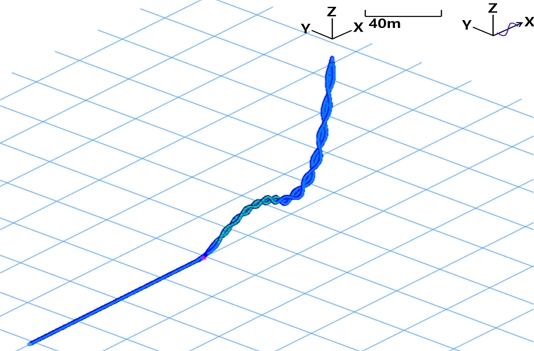
There is a “Zone 1” legend in Fig.5 that is the independent time series of excited modes. Although real field tests found that several frequencies were manifest simultaneously, Shear7 allows only one particular frequency to be excited in a certain interval which is called time sharing method. Shear7 allows up to three independent time zone on the structure which is the concept of space sharing of some mode. These zones are made independently by allowing the time sharing probabilities to add up to one (Shear7, 2021). The excited modes in Fig. 5 demonstrate that approximately between 0 and ~550s, mode No. 6 is excited while between ~550 to ~600s, mode No. 7 is excited, then mode No. 4 and mode No. 5 are excited in consecutive order. Relatively lower number of modes were excited due to subtle current speeds along the cable length. For instance, below Fig. 6 and Fig. 7 illustrate 4th and 7th excited mode shapes of Profile 1.0 respectively.
4.2 Higher modes excitation by VIV
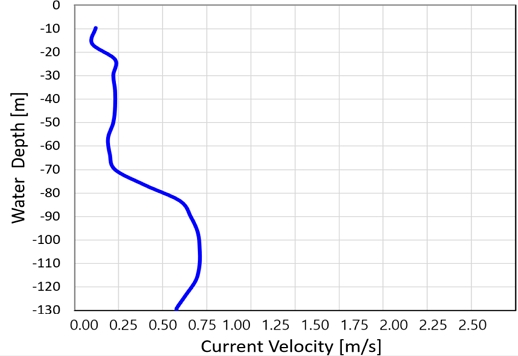
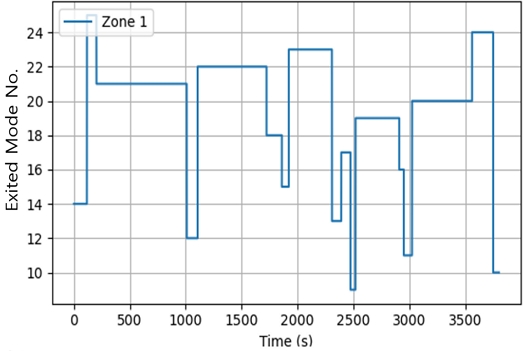
When the velocity of sheared current profile becomes stronger, the higher mode numbers tends to be excited by VIV prediction. For example, when Profile 28.0 (Fig. 8) was applied for the excited modes prediction, higher mode numbers, specifically from No. 9 to No. 25 were excited as illustrated in Fig. 9.
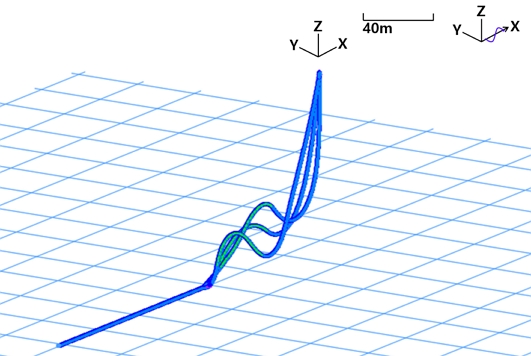
The mode superposition method is commonly employed to predict the response of uniform or nearly uniform structures that exhibit low mode numbers and has proven to be successful in such cases. However, when dealing with structures that respond at high mode numbers (greater than the tenth mode), resulting in traveling waves rather than standing waves, the mode superposition method may encounter limitations. To account for traveling wave behavior, the method requires the inclusion of a significant number of non-resonant modes, as discussed by Jaiswal and Vandiver(2007). In this context, the traveling wave seemed to arise along the cable due to strong sheared current profile. Below figures (Fig. 10 & Fig. 11) are excited mode shapes i.e. the 9th mode and the 25th mode of Profile 28.0.
5. VIV fatigue analysis
5.1 Curvature amplitude variations
Curvature time series of each node along the cable have been calculated by Shear7 to estimate accumulated fatigue damages.
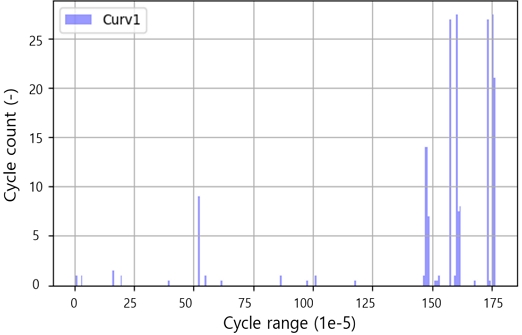
For example, Fig. 12 presents the curvature time series on node 1 (hang-off position). Between 0 and ~550s, the response of the curvature of node 1 is a little above 0.00075 1/m, while the between ~550 to ~600, mode No. 7 is excited with a response of a little above 0.00025 1/m. In addition, the power spectral density and cycle counting of curvature time series on node 1 of Profile 1.0 are shown in below Fig. 13 & Fig. 14.
Now the fatigue damage calculation in Helica is ready to be performed.
5.2 VIV fatigue analysis steps
Current data consist of 481 different current profiles. The VIV analysis has been performed based on these current profiles in accordance with the procedure described in Section 2 under the assumption that the cross-flow VIV would be critical from current loading. To conduct a fatigue analysis in Helica, the VIV results have been obtained from Shear7, i.e. the curvature time series of each node along the dynamic power cable. The inner tensile armor was chosen for fatigue analysis considering that two layers of tensile armor accounts for most fatigue damages, furthermore the inner tensile armor is supposed to have the greater curvature compared to the outer tensile armor. Next, following steps have to be made for fatigue analysis.
- • Establishes cross-sectional properties
- • Produces the capacity curve for the component
- • Establishes the boundary conditions for the layer, stick/slip behavior, etc.
- • Runs fatigue analysis per load case by combining tension and curvature with cross-sectional properties
- • Accumulates the fatigue damage for each load case with associated probability level
5.3 VIV fatigue analysis results
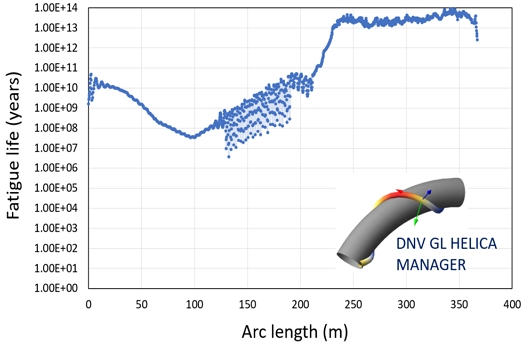
For the cross-flow VIV direction (current in in-line direction), the calculated fatigue life along the arc length of the cable, i.e. from hang-off to the seabed is presented in Fig. 15 for example. In this case, the minimum fatigue life is 3,800,000 years occurred at 132.25m of the arc length. In most cases, the critical areas are typically located at the interface with the floater. To prevent excessive bending in extreme load conditions and minimize long-term fatigue loading, bend limiting devices such as bend stiffeners or bellmouths are implemented at these interfaces (Skeie, 2016). Otherwise, several low peaks on the curve could be found, which are located around the hang-off, buoyancy modules and touch-down segments (Sung and Yang, 2019). According to the references, the lowest fatigue life is usually expected to be located at hang-off or touch-down position, which are typical results observed in other subsea umbilical design. In this study, it seemed that a bend stiffener has a positive influence on the fatigue lives. In addition to that, compared to the catenary line configuration, the lazy wave configuration appears to have uncertain characteristics about curvature variations along the cable, especially when sheared currents exist. In this case, the location of the lowest fatigue life was found around an inflection point from sag band to hog band of the cable.
The relative contribution (%) of current loading cases to the lowest fatigue life is plotted in Fig 16. In this case, the 410th loading condition contributes maximally 18.3% to the lowest fatigue life, which showed the excited mode No. from 12 to 30 in cross-flow VIV direction.
5.4 Sensitivity studies by Shear 7
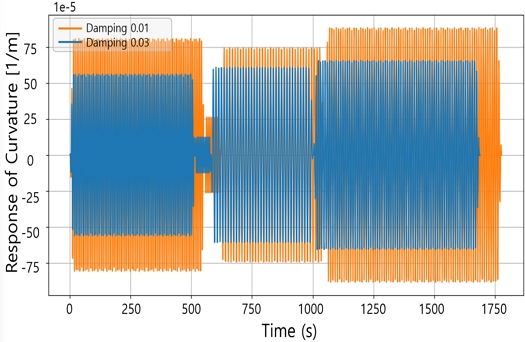
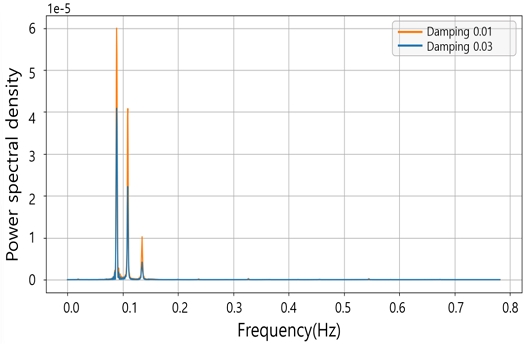
This subject is related to the structural damping ratio specified for the cable. The model for hydrodynamic excitation in the excitation regions incorporates hydrodynamic damping. The inclusion of structural damping in the excitation region is addressed independently (Vandiver et al., 2018). The default value of structural damping ratio of Shear7 is 0.003, i.e. 0.3% of critical damping. It is a typical damping level for steel pipes. For the most cylinders under high tension in water, the structural damping is usually small because the hydrodynamic damping is much larger than the structural damping except for uniform flow cases. It should be noted that the friction between the helically layered components results in a greater structural damping in dynamic power cable or umbilicals compared to steel pipes. Passano et al. (2016) mentioned the damping level as a ratio to the critical damping was found to be 1.47% and the effects of increasing the damping level from the initial 1% to the estimated 1.47% and further to 3.5% was shown as the reduction of the maximum curvature amplitude was 55%. The influence of damping level on curvature amplitudes is significant. If the stresses are directly related to the curvatures, the reduction in fatigue damage will be even more remarkable (Passano et al., 2016). Sodahl et al. (2011) provided an estimation of the structural damping using an equivalent viscous modal damping ratio, which ranged from 0.01 to 0.15 relative to the critical modal damping. Additionally, it is necessary to establish the dissipated energy caused by material damping through full-scale testing of the specific cross section. It has been shown that the damping induced by stick/slip motion can surpass the expected material damping, which is typically anticipated to be in the range of 1% to 3%. Referring to previous researches, the structural damping ratio of 1% has been used conservatively in the present study. Furthermore, the structural damping ratio of 3% are implemented for the purpose of sensitivity studies. For example, the curvature amplitudes of hang-off position (node 1) for Profile 1.0 became smaller as shown in Fig. 17 when curvature time series are compared in terms of structural damping ratios, specifically 0.01 (Orange) and 0.03 (Blue). The maximum curvature was reduced by 26% approximately from 0.000883 to 0.0006559 (1/m). These were also verified by the power spectral density in Fig. 18.
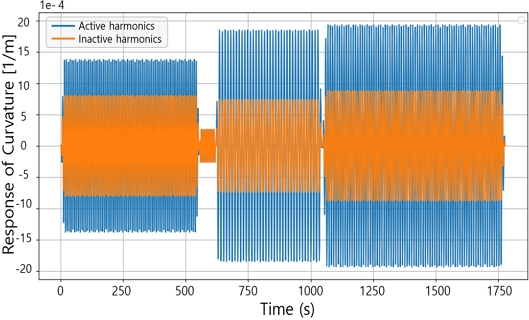
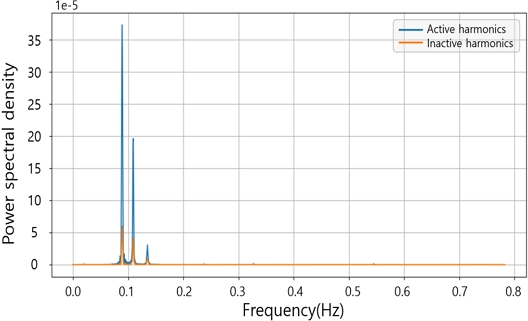
VIV software predicts the VIV response by the vortex shedding frequencies, which are given by the strouhal number, called the fundamental VIV frequency, however higher order response is observed in some dedicated experiments, i.e. 3ω and 5ω where ω is the fundamental VIV frequency. Higher order harmonics are not fully understood because they are partly caused by the structural response at high frequencies, and partly caused by the higher loading terms, for example possibly coupling of in-line and cross-flow loads interaction. Jaiswal et al. (2007) reported that the PSD (Power Spectral Density) analysis of strain reveals the presence of the primary shedding frequency (denoted as 1x). Additionally, a broad peak three times the primary shedding frequency (labeled as 3x), is observed in the PSD. The experimental data also confirms the existence of higher harmonics, specifically the 3x peak. Vandiver et al. (2006) stated that vibrations related to the fundamental VIV frequency are frequently accompanied by vibrations occurring at integer multiples of this frequency. Among these multiples, the odd multiples are linked to vibrations in the cross-flow direction, while the even multiples correspond to vibrations in the in-line direction. Their findings indicate that the 3x frequency response component results in significantly higher fatigue damage, ranging from twenty to forty times that of the fundamental frequency of cross-flow vibration. The closely spaced natural frequencies contribute to resonant behavior at these higher harmonics. Jhingran and Vandiver(2007) described that the maximum rate of damage, as deduced from the data, surpasses the maximum predicted by Shear7 by a factor of 3. This discrepancy becomes evident at the specific location where the 3x and 5x components exhibit the greatest magnitude. Vandiver et al. (2018) also reported that under certain conditions, it is possible for significant force components at three times the cross-flow frequency to emerge. These force components are most pronounced when the phases of the cross-flow and in-line motions are such that they generate counterclockwise figure-eight trajectories. Furthermore, it has been observed that high mode number response is prevalent within the frequency range spanning the 10th to the 30th mode. In Shear7, empirical models are incorporated to excite the high order harmonics excitation. If higher harmonics are required, the higher harmonics amplification factor is suggested as 3.33 for a bare cylinder with cross-flow VIV direction, and the value of 0.4 is considered the recommended threshold for higher harmonics. When the amplitude of a higher harmonics component exceeds this threshold, an amplification factor specific to higher harmonics is applied. For example, the curvature variations of hang-off position (node 1) for Profile 1.0 are compared in the time series as shown in Fig 19. When the higher harmonics were active (Blue), the magnitude of curvature amplitude has been multiplied by the amplification factor. Consequently, the maximum curvature increased by 219% roughly from 0.000883 to 0.001935 (1/m). These energy differences were also verified by the power spectral density in Fig. 20.
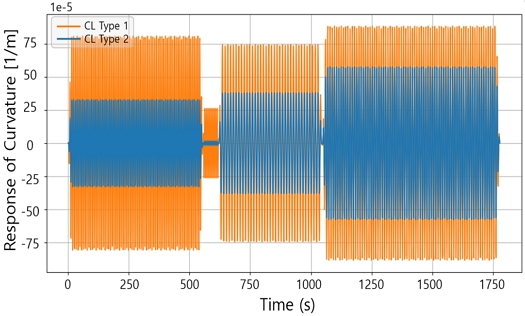
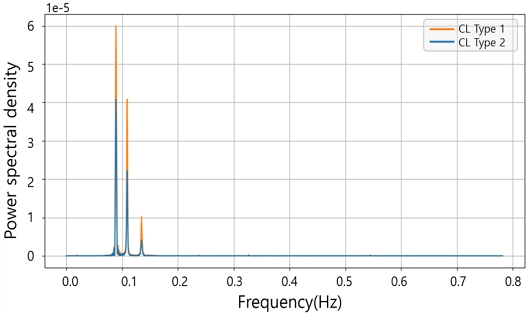
The CL Type Number in Shear7 specifies what type of a lift coefficient table in “common.S7CL” file will be used in Shear7. CL Type 1 is the default for a bare cylinder and the cross-flow VIV response, which is conservative. CL Type 2 is also for a bare cylinder and the cross-flow VIV response, however it is supposed to yield smaller response values compared to CL Type1. This discrepancy arises due to the utilization of mean values of observations, which inherently dampen the overall response. Hereafter CL Type 2 has been tested for the fatigue life. Vandiver et al. (2018) mentioned that with respect to the lift coefficient tables, the first table is a conservative approach that considers only the aspect ratio (A/D, A: amplitude of response, D: hydrodynamic diameter) of the cylinder. This table provides a upper bound prediction for the response, applicable to all flexible cylinders in sub-critical flow. The second lift coefficient table takes into account both the aspect ratio (A/D) and the reduced velocity. This table provides response predictions that closely align with the mean values observed in measured sub-critical response data. For example, the comparison of the curvature time series between CL Type 1 (Orange) and CL Type 2 (Blue) are presented in Fig. 21 at the hang-off position (node 1) for Profile_1.0 for the cross-flow VIV direction. The maximum curvature was reduced by 35% approximately from 0.000883 to 0.0005765 (1/m). Just as the time series of CL Type 2 shows the relatively smaller curvature amplitudes, the power spectral density verified the lower energy as illustrated in Fig. 22.
6. Conclusion
In this research, the procedure of VIV fatigue analysis for dynamic power cables or umbilicals have been established by utilizing three commercial programs, specifically OrcaFlex, Shear7 and Helica. This calculation method could be applied to any helically wound long flexural structures that consist of various components. The VIV fatigue damage evaluation of helical structures greatly depends on the intensity of sheared current profiles, and the static analysis results of the cable line configurations and mode shapes. VIV prediction has mainly been made by the empirical force based model and the time sharing method from which the excited modes and frequencies, curvature time series, and cycle counting have been obtained. Cross-sectional properties of the cable can be estimated for the capacity curve, bending stiffness, torsional moment, and contact forces in layers, etc. The accumulated long-term fatigue life has been assessed by fatigue damages of each node of the cable and probabilities of % occurrence of current profiles. The dynamic power cable developed for this study showed 3,800,000 years of the minimum fatigue life for cross-flow VIV occurred at 132.25m of the arc length at which the inflection point of sag bend and hog bend is located. Furthermore, the most severe current loading condition can be identified, for instance, in this study the 410th loading condition contributed maximally to the lowest fatigue life which showed relatively high mode numbers excited in cross-flow VIV direction. Finally, sensitivity studies have been performed to check the design parameters, specifically, structural damping ratio, higher order harmonics, and lift coefficients tables. When the structural damping ratio for the dynamic power cable was increased from 0.01 to 0.03 (3% of critical damping), the curvature amplitudes decreased by 26% compared to the initial case. The fatigue life would be expected to increase accordingly. In the case of activating higher order harmonics, the fatigue life has been forecasted to be reduced due to 219% of magnified curvature variations by the resonant behavior between the closely spaced natural frequencies and 3x frequency response components. In terms of shifting the lift coefficient tables, the CL Type 2 presented the less conservative results. As a result, the maximum curvature has been reduced by approximately 35% when the initial CL Type 1 of the lift coefficient table was replaced by CL Type 2. The VIV response of Shear7 stems from the assumption that it complies with a narrow-banded Gaussian process with a standard deviation derived from the VIV amplitudes. This approach is consistent with the material and guidance of the industries. The other approach to obtain the VIV responses is based on time-domain results which will be reported by deterministic signals with the constant amplitude of curvature. In the future, more research on the potential errors between the Gaussian process and the deterministic time series will be carried out to confirm their level of consistency and verify one of the fundamental assumptions using time sharing method.
Acknowledgments
This work was supported by the Korea Institute of Energy Technology Evaluation and Planning (KETEP) and the Ministry of Trade, Industry & Energy (MOTIE) of the Republic of Korea (No. 20203030020230).
This result was supported by "Regional Innovation Strategy (RIS)" through the National Research Foundation of Korea (NRF) funded by the Ministry of Education (MOE) (Project Management Number of the Foundation: Gwangju Jeonnam Platform 2021RIS-002)
References
- Cigre technical brochure 862 (Cigre TB 862), 2022. Recommendations for mechanical testing of submarine cables for dynamic applications. Cigre, inc.
-
Fu, S., Wang, J., Baarholm, R., Jie, W. and Larsen, C.M., 2013. VIV of flexible cylinder in oscillatory flow. Proceedings of the ASME 2013 32nd International Conference on Ocean, Offshore and Arctic Engineering. pp. 1-14.
[https://doi.org/10.1115/OMAE2013-10348]

-
Jaiswal, V. and Vandiver, J.K., 2007. VIV response prediction for long risers with variable damping. Proceedings of the 26th International Conference on Offshore Mechanics and Arctic Engineering. pp.901-909.
[https://doi.org/10.1115/OMAE2007-29353]

-
Jhingran, V. and Vandiver, J.K., 2007. Incorporating the higher harmonics in VIV fatigue predictions. Proceedings of the 26th International Conference on Offshore Mechanics and Arctic Engineering. pp.891-899.
[https://doi.org/10.1115/OMAE2007-29352]

-
Kim, Y.C. and Rheem, C.Y., 2009. Cross flow response of a cylindrical structure under local shear flow. International Journal of Naval Architecture and Ocean Engineering, 1(2), pp.101-107.
[https://doi.org/10.3744/JNAOE.2009.1.2.101]

-
Lekkala, M.R., Latheef, M., Jung, J.H., Kim, Y.T. and Kim, D.K., 2022. Fatigue damage assessment of offshore riser subjected to vortex-induced vibrations by SHEAR7. International Journal of Naval Architecture and Ocean Engineering. 14, 100464.
[https://doi.org/10.1016/j.ijnaoe.2022.100464]

-
Maincon, P. and Larsen, C.M., 2011. Towards a time-domain finite element analysis of vortex induced vibrations. Proceedings of the ASME 2011 30th International Conference on Ocean, Offshore and Arctic Engineering. pp.415-425
[https://doi.org/10.1115/OMAE2011-49539]

-
Marcollo, H., Eassom, A., Fontaine, E., Tognarelli, E., Beynet, P., Constantinides, Y. and Oakley, O., 2011. Traveling wave response in full-scale drilling riser VIV measurements. Proceedings of the ASME 2011 30th International Conference on Ocean, Offshore and Arctic Engineering. pp.523-537
[https://doi.org/10.1115/OMAE2011-49821]

-
Passano, E., Abtahi, S. and Ottesen, T., 2016. A Procedure to include slip damping in a VIV analysis of an umbilical. Proceedings of the ASME 2016 35th International Conference on Ocean, Offshore and Arctic Engineering.
[https://doi.org/10.1115/OMAE2016-54816]

-
Passano, E., Larsen, C.M. and Wu, J., 2010. VIV of free spanning pipelines: comparison of response from semi-empirical code to model tests. Proceedings of the ASME 2010 29th International Conference on Ocean, Offshore and Arctic Engineering. pp.567-577.
[https://doi.org/10.1115/OMAE2010-20330]

-
Pagnini, L.C., Piccardo, G. and Solari, G., 2020. VIV regimes and simplified solutions by the spectral model description. Journal of Wind Engineering & Industrial Aerodynamics.
[https://doi.org/10.1016/j.jweia.2020.104100]

-
Rao, Z., Vandiver, J.K. and Jhingran, V., 2013. VIV excitation competition between bare and buoyant segments of flexible cylinders. Proceedings of the ASME 32nd International Conference on Offshore Mechanics and Arctic Engineering.
[https://doi.org/10.1115/OMAE2013-11296]

-
Schiller, R.V., Caire, M., Nóbrega, P.H.A., Passano, E. and Lie, H., 2014. Vortex induced vibrations of deep water risers: sensitivity to current profile, shear and directionality. Proceedings of the ASME 2014 33rd International Conference on Ocean, Offshore and Arctic Engineering.
[https://doi.org/10.1115/OMAE2014-24141]

- Shear7, AMOG, MIT, 2021. User Guide for SHEAR7 Version 4.11. MIT Report.
-
Shim, C.S., Kim, C.B., Rho, Y.H., Lee, J.B., Chae, K.S., Song, H.C., Kim, H.K., Bea, C.M., Wi, S.K. and Im, K.C., 2021. A Study for Durability Test of Dynamic Power Cable under Marine Operating Environment Condition. Journal of the Society of Naval Architects of Korea, 58(1), pp.49-57.
[https://doi.org/10.3744/SNAK.2021.58.1.049]

- Skeie, G., 2016. SESAM White Paper Helica. Cross section analysis of compliant structures – flexibles, umbilicals and cables. DNV GL Report.
-
Sodahl, N., Steinkjer, O., Gjo̸lmesli, E. and Hansen-Zahl, K., 2011. Consistent VIV fatigue analysis methodology of umbilicals. Proceedings of the ASME 2011 30th International Conference on Ocean, Offshore and Arctic Engineering. pp.439-447
[https://doi.org/10.1115/OMAE2011-49459]

-
Soni, P.K. and Larsen, C.M., 2009. Vortex pattern comparison for periodic and harmonic combined cross-flow & in-line forced oscillations. Proceedings of the ASME 2009 28th International Conference on Ocean, Offshore and Arctic Engineering. pp.853-867
[https://doi.org/10.1115/OMAE2009-80089]

-
Srinil, N., Wiercigroch, M. and O’Brien, P., 2009. Vortex-induced vibration of catenary riser: Reduced-order modeling and lock-in analysis using wake oscillator. Proceedings of the ASME 2009 28th International Conference on Ocean, Offshore and Arctic Engineering. pp.1404-1414
[https://doi.org/10.1016/j.oceaneng.2009.08.010]

- Sung, Y.B. and Yang, B.H., 2019. Power Cable Design and Dynamic Analysis for a Hybrid Platform, The 29th International Ocean and Polar Engineering Conference.
-
Vandiver, J.K., Ma, L. and Rao, Z., 2018. Revealing the effects of damping on the flow-induced vibration of flexible cylinders. Journal of Sound and Vibration. pp.29-54.
[https://doi.org/10.1016/j.jsv.2018.07.009]

-
Vandiver, J.K., Swithenbank, S.B., Jaiswal, V. and Jhingran, V., 2006. Fatigue damage from high mode number vortex-induced vibration. Proceedings of the 26th International Conference on Offshore Mechanics and Arctic Engineering. pp.803-811.
[https://doi.org/10.1115/OMAE2006-92409]

-
Wu, H., Rheem, C.K., Chen, W., Xu, S. and Wu, W., 2021. Experimental study on the tension of cables and motion of tunnel element for an immersed tunnel element under wind, current and wave. International Journal of Naval Architecture and Ocean Engineering, 13(1), pp.889-901.
[https://doi.org/10.1016/j.ijnaoe.2021.06.006]

-
Wu, J., Lie, H., Fu, S., Baarholm, R. and Constantinides, Y., 2017. VIV responses of riser with buoyancy elements: forced motion test and numerical prediction. Proceedings of the ASME 2017 36th International Conference on Ocean, Offshore and Arctic Engineering.
[https://doi.org/10.1115/OMAE2017-61768]

-
Wu, J., Mainc¸on, P., Larsen, C.M. and Lie, H., 2009. VIV force identification using classical optimal control algorithm. Proceedings of the ASME 2009 28th International Conference on Ocean, Offshore and Arctic Engineering. pp. 559-570.
[https://doi.org/10.1115/OMAE2009-79568]

-
Zhang, C., Kang, Z., Stoesser, T., Xie, Z. and Massie, L., 2020. Experimental investigation on the VIV of a slender body under the combination of uniform flow and top-end surge. Ocean Engineering, 216, 108094.
[https://doi.org/10.1016/j.oceaneng.2020.108094]

-
Zheng, H., Price, R., Modarres-Sadeghi, Y., Triantafyllou, G.S. and Triantafyllou, M.S., 2011. Vortex-induced vibration analysis (VIVA) based on hydrodynamic databases. Proceedings of the ASME 2011 30th International Conference on Ocean, Offshore and Arctic Engineering. pp.657-663.
[https://doi.org/10.1115/OMAE2011-50192]


